
The numbers for 2023 are no higher than normal either
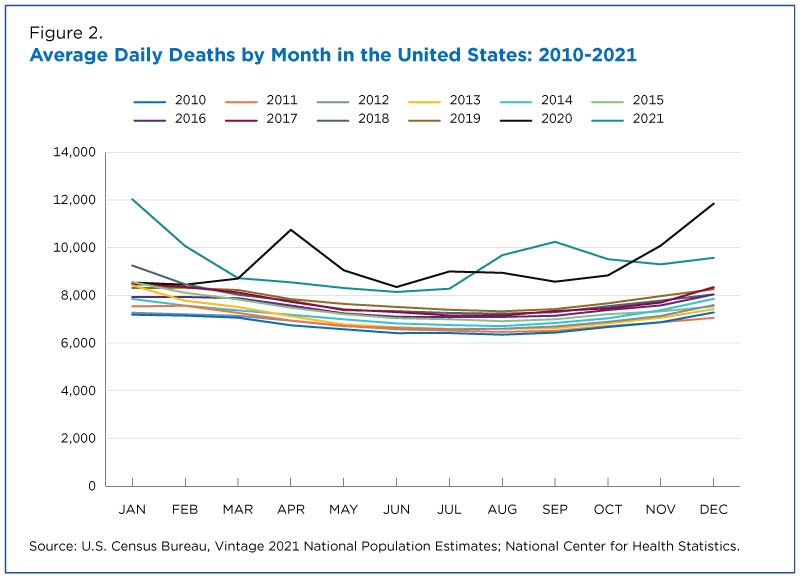
The numbers for 2023 in the 2-3 months you have data for. Look at the rest of the graph, how it starts off lower in January and is higher for the rest of the year. Go back up and look at this graph 
and see how covid comes in waves each year, not evenly distributed throughout. Then go back and look at this graph 
and see that based on the data we have in the US, deaths per year has stayed above the previous yearly patterns. We don’t have all the data over a long period of time because covid hasn’t been around for all that long. But from what we can see so far, it kills people. The exact number per year remains to be seen, but from the data we have it’s been in the thousands, just in Norway.
Edit: I guess next time I see a fucking “mOVInG tHe GOOalPoSt!!!” I will take the clue and not fucking bother.
Half of the sources you posted actively worked against your own arguments. Maybe you shouldn’t bother.
EDIT of my own: After looking at one of your sources (Eurostat)

you can see that January-March was lower than 2016-2019, but it’s been on the rise again across the EU, and especially in Norway. Again, you can’t just look at one single month and decide that it’s representative of everything, everywhere, across all time going forward.

You should probably be looking at trends over a longer period of time, rather than just a single month.
From here. There was a dip below the 2016-2019 average in January through March of 2023, but time marches on.